Putatively mapped varietal SNPs
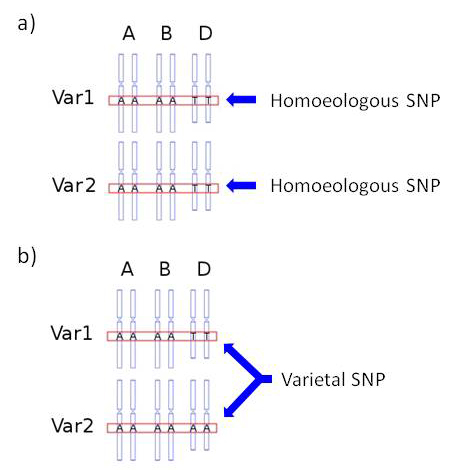
The NimbleGen array capture/Illumina NGS sequencing of the 8 varieties Alchemy, Avalon, Cadenza, Hereward, Rialto, Robigus, Savannah and Xi19 produced a large number of putative SNPs (511,439): see articles by Allen et al. (2011) and Winfield et al. (2012). These included both homoeologous (411,494 = 80.5%) and varietal SNPs (99,945 = 19.5%) - see explanatory image below. Of these 99,945 varietal SNPs, only a relatively small number have been validated and mapped (c. 7,000; see the KASP SNP database page of this web site for precise numbers). However, we have provisionally mapped many of the non-validated, putative varietal SNPs. As we fully recognise the potential importance of these, we are making them available here. Please be aware, however, that the chromosome locations provided are only putative and, as further work is carried out, they may be revised.

The table below gives the number of putative varietal SNPs between any two varieties. To obtain an Excel spreadsheet containing a list of these and the chromosomes to which they are provisionally located click on the blue, underlined numbers in the table below.
| Alchemy | Avalon | Cadenza | Hereward | Rialto | Robigus | Savannah | Xi19 | |
|---|---|---|---|---|---|---|---|---|
| Alchemy | 19,346 | 14,836 | 21,528 | 24,921 | 16,815 | 28,776 | 7,822 | |
| Avalon | 19,346 | 7,886 | 11,735 | 13,507 | 9,282 | 16,307 | 4,097 | |
| Cadenza | 14,836 | 7,886 | 9,083 | 355 | 7,223 | 11,944 | 658 | |
| Hereward | 21,528 | 11,735 | 9,083 | 16,429 | 11,489 | 21,965 | 4,100 | |
| Rialto | 24,921 | 13,507 | 355 | 16,429 | 11,831 | 21,472 | 1,357 | |
| Robigus | 16,815 | 9,282 | 7,223 | 11,489 | 11,831 | 15,031 | 3,371 | |
| Savannah | 28,776 | 16,307 | 11,944 | 21,965 | 21,472 | 15,031 | 6,309 | |
| Xi19 | 7,822 | 4,097 | 658 | 4,100 | 1,357 | 3,371 | 6,309 |
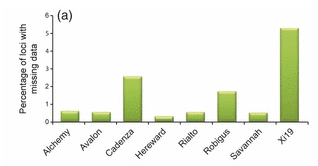
When considering the numbers presented in the table above, one needs to be aware that the read depth, and thus the number of missing reads, was very different between the eight varieties. The varieties Alchemy and Savannah had the highest read depth and Xi19 had the lowest: the number of missing reads was inversely proportional to the read depth (see bar chart below).

Based at the University of Bristol with support from BBSRC.

